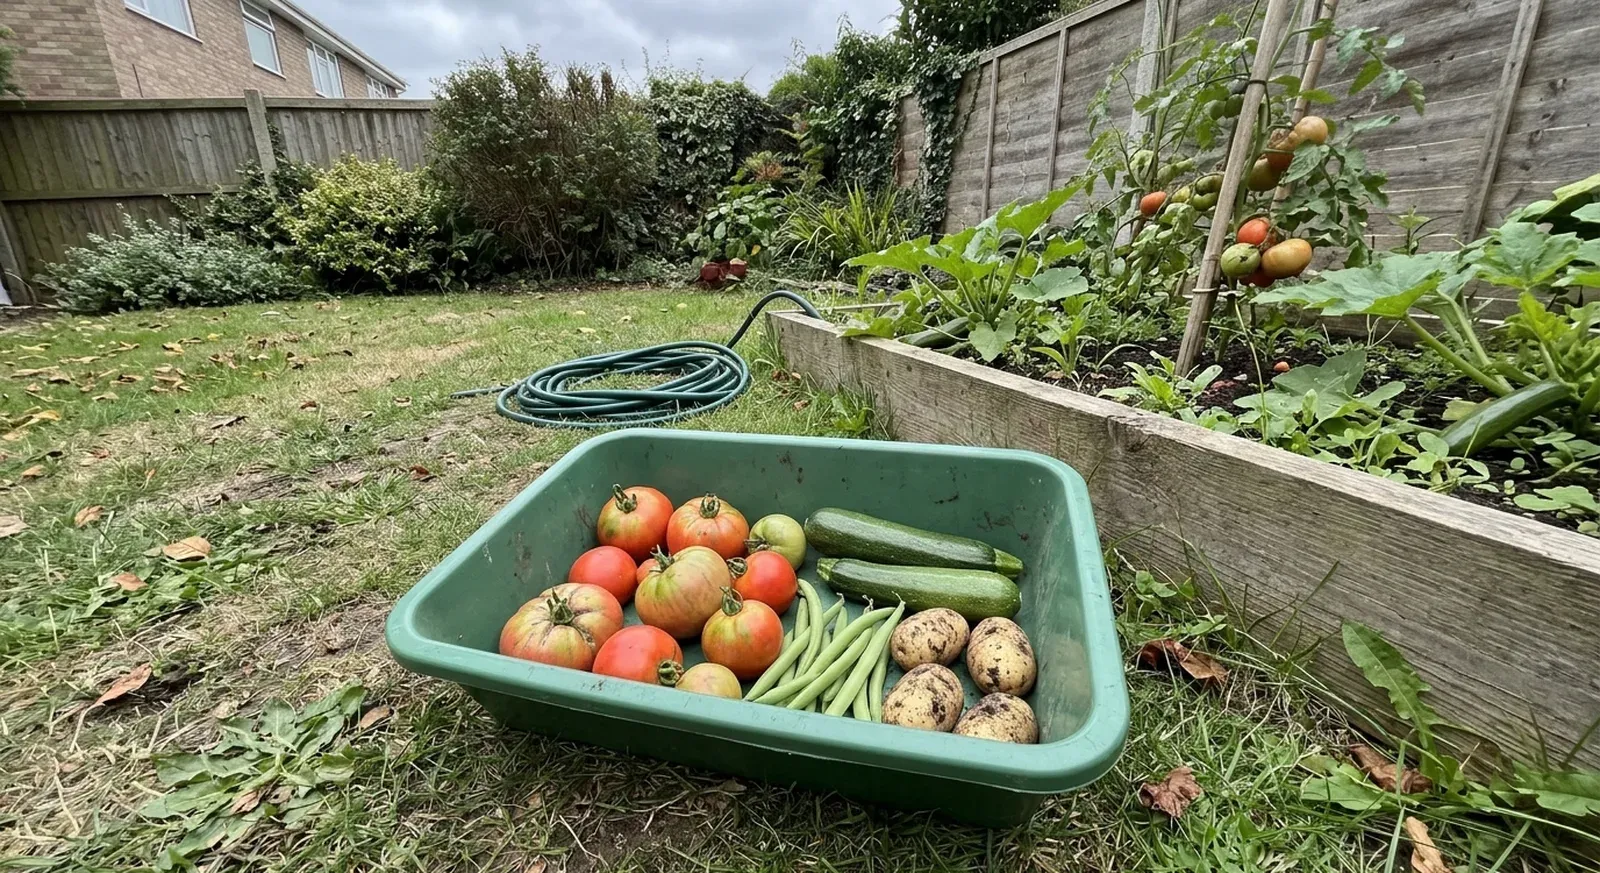
One outdoor tomato plant gives 2 to 6 lb (0.9 to 2.7 kg) in University of Minnesota Extension’s planning figures and 12 to 15 lb (5.4 to 6.8 kg) in southern and central Wisconsin gardens according to University of Wisconsin Extension. A 10 ft (3 m) row gives 15 to 45 lb of tomatoes, 10 to 20 lb of potatoes or 7 to 10 lb of carrots in Virginia Cooperative Extension’s 2025 tables. Measured US gardens produced 0.51 lb per sq ft (Laramie, Wyoming) and 0.75 lb per sq ft (San Jose, California) a season. In the UK MYHarvest study, which measured each crop on the ground it occupied, per-crop yields averaged 0.40 lb per sq ft (1.93 kg/m²) a year across 39 crops. Single gardens ranged from almost nothing to about 2 lb per sq ft (10 kg/m²), so every average below hides very different gardens.
Last updated: 21 October 2026.
The yield figure on a seed packet is a forecast. The numbers in this article come from two kinds of source, and I keep them apart throughout.
The first kind is expected yield: what US extension services tell gardeners to plan for, per plant and per 10 ft of row, with the UK’s Royal Horticultural Society (RHS) added for soft fruit. The second kind is measured yield: what researchers recorded when real gardeners weighed their harvests and measured the ground they used. The measured whole-garden data comes from the US, Canada and the UK. The per-crop measured data comes from the UK, where the University of Sheffield’s MYHarvest project collected five years of garden and allotment harvests.
Pounds and feet come first, with kilograms and metres alongside. Where a source published in metric, its own unit is kept and the imperial figure is a conversion. The source and year sit next to each number. When I could not find a source to check for a figure, I left the cell empty.
This page covers how much you harvest. For how long crops take, see days to maturity for vegetables. For how far apart to plant them, see the plant spacing guide. For how to weigh and record your own harvests, see garden harvest tracking and yield recording.
How much does a tomato plant produce?
Published estimates for a single tomato plant span roughly tenfold, from about 2 lb to over 20 lb (0.9 to 9 kg). The table gives the conditions behind each figure.
| Source (year) | Conditions | Yield per plant | Metric |
|---|---|---|---|
| University of Minnesota Extension (reviewed 2026) | Slicer or Roma, field | 2–6 lb | 0.91–2.7 kg |
| University of Minnesota Extension (reviewed 2026) | Cherry, field | 2–6 lb | 0.91–2.7 kg |
| University of Minnesota Extension (reviewed 2026) | Slicer or Roma, high tunnel | 8–20 lb | 3.6–9.1 kg |
| University of Minnesota Extension (reviewed 2026) | Cherry, high tunnel | 8–13 lb | 3.6–5.9 kg |
| University of Wisconsin Extension A1691 (2017) | Home gardens, southern and central Wisconsin | 12–15 lb | 5.4–6.8 kg |
| University of Wisconsin Extension A1691 (2017) | Home gardens, northern Wisconsin | 7–9 lb | 3.2–4.1 kg |
| Ohio State University South Centers (2012) | 8 fresh-market cultivars, raised beds with plastic mulch and trickle irrigation, planted late (21 June) | 3.65–11.66 lb marketable | 1.7–5.3 kg |
| Mississippi State University Extension P3616 (2025) | “Some tomato varieties available today” | over 20 lb | over 9.1 kg |
Per square foot, backyard tomatoes in Guelph, Ontario averaged 0.58 lb (2.85 kg/m²) in the 2012 season (CoDyre et al., 2015). UK garden and allotment tomatoes averaged 0.94 lb per sq ft (4.57 kg/m²) a year in the MYHarvest study, 2017 to 2022 (Gulyas, 2023). In the same UK study, growing tomatoes in a greenhouse added 0.19 lb per sq ft (0.95 kg/m², ±0.31 SE) a year compared with growing them outdoors.
Vegetable yield per plant
These are per-plant figures from US extension services. University of Minnesota Extension’s figures are planning estimates for vegetable farms. Penn State Extension’s figures are averages and ranges measured in cultivar trials at three Pennsylvania sites since 2008. Penn State links the growing method for each crop; its acorn squash, for example, grew on raised rows with drip tape and black plastic mulch. Penn State warns that its values may not apply to squash grown on bare, flat, rain-fed ground.
| Vegetable | Yield per plant (as published) | Metric | Source (year) |
|---|---|---|---|
| Pepper, bell (field) | 1.25–2.5 lb | 0.57–1.1 kg | Univ. of Minnesota Extension (2026) |
| Pepper, bell (high tunnel) | 3–5 lb | 1.4–2.3 kg | Univ. of Minnesota Extension (2026) |
| Pepper, green bell (trial average, range) | 3.9 lb marketable (1.3–6.3 lb) | 1.8 kg (0.59–2.9 kg) | Penn State Extension (2025) |
| Pepper, jalapeño or serrano (high tunnel) | 2.5 lb | 1.1 kg | Univ. of Minnesota Extension (2026) |
| Aubergine (eggplant) | 1.25 lb | 0.57 kg | Univ. of Minnesota Extension (2026) |
| Cucumber (field) | 3–5 lb per plug of 2 seeds | 1.4–2.3 kg | Univ. of Minnesota Extension (2026) |
| Cucumber (high tunnel) | 10–15 lb | 4.5–6.8 kg | Univ. of Minnesota Extension (2026) |
| Courgette (zucchini) and summer squash | 3–3.5 lb | 1.4–1.6 kg | Univ. of Minnesota Extension (2026) |
| Winter squash | 4–12 lb | 1.8–5.4 kg | Univ. of Minnesota Extension (2026) |
| Butternut squash (trial average, range) | 15.9 lb marketable (9.9–28.7 lb) | 7.2 kg (4.5–13.0 kg) | Penn State Extension (2025) |
| Acorn squash (trial average, range) | 12 lb marketable (5.9–24.2 lb) | 5.4 kg (2.7–11.0 kg) | Penn State Extension (2025) |
| Buttercup or kabocha squash (trial average, range) | 10.6 lb marketable (1.8–26.6 lb) | 4.8 kg (0.82–12.1 kg) | Penn State Extension (2025) |
| Pumpkin (trial average, range) | 38.5 lb marketable (21.8–61.0 lb), 2.1 fruit | 17.5 kg (9.9–27.7 kg) | Penn State Extension (2025) |
| Sweetcorn (trial average) | 0.93 marketable ears, 0.7 lb | 0.32 kg | Penn State Extension (2025) |
| Melon, muskmelon (trial average) | 1.6 lb marketable, 0.93 fruit | 0.73 kg | Penn State Extension (2025) |
| Watermelon | 3–10 lb | 1.4–4.5 kg | Univ. of Minnesota Extension (2026) |
| Broccoli | 1–1.3 lb | 0.45–0.59 kg | Univ. of Minnesota Extension (2026) |
| Broccoli, autumn head (trial average, range) | 0.87 lb (0.41–1.89 lb) | 0.39 kg (0.19–0.86 kg) | Penn State Extension (2025) |
| Broccoli, spring head (trial average, range) | 0.58 lb (0.34–0.79 lb) | 0.26 kg (0.15–0.36 kg) | Penn State Extension (2025) |
| Cabbage | 1–2 lb | 0.45–0.91 kg | Univ. of Minnesota Extension (2026) |
| Cauliflower | 1–1.3 lb | 0.45–0.59 kg | Univ. of Minnesota Extension (2026) |
| Kale (continuous harvest) | 2.75–4 lb | 1.2–1.8 kg | Univ. of Minnesota Extension (2026) |
| Collards | 0.75–1 lb | 0.34–0.45 kg | Univ. of Minnesota Extension (2026) |
University of Minnesota Extension does not give potato yield per plant. Its figure for potatoes is a ratio: 6 to 10 lb harvested for every 1 lb of seed potato planted (1:6 to 1:10 by weight).
Across a mixed vegetable garden, 10 San Jose community gardeners who weighed every vegetable harvest in 2012 averaged 2.55 lb (1.2 kg) of vegetables per plant, with individual gardeners ranging from 1.52 to 3.2 lb (0.69 to 1.5 kg) per plant (Algert et al., 2014).
Vegetable yield per 10 ft of row
Row yields depend on in-row spacing, so the spacing from the same table is shown. Virginia Cooperative Extension publishes yield per 10-ft (3.05 m) row directly. Mississippi State University Extension publishes yield per 100-ft (30.5 m) row. Mississippi State notes that its figures for tomatoes, peppers, aubergine and pole beans cover multiple harvests over a period.
| Vegetable | In-row spacing (Virginia) | Virginia, per 10-ft row (2025) | Metric, per 3.05 m | Mississippi, per 100-ft row (2025) | Metric, per 30.5 m |
|---|---|---|---|---|---|
| Asparagus | 12–18 in (30–46 cm) | 3–4 lb | 1.4–1.8 kg | 30 lb | 13.6 kg |
| Beans, bush (snap) | 1–3 in (2.5–7.6 cm) | 3–5 lb | 1.4–2.3 kg | 60 lb | 27.2 kg |
| Beans, pole (snap) | 4–12 in (10–30 cm) | 6–10 lb | 2.7–4.5 kg | 80 lb | 36.3 kg |
| Beetroot | 2–3 in (5–7.6 cm) | 8–10 lb | 3.6–4.5 kg | 75 lb | 34.0 kg |
| Broccoli | 12–24 in (30–61 cm) | 4–6 lb | 1.8–2.7 kg | 50 lb | 22.7 kg |
| Brussels sprouts | 18–24 in (46–61 cm) | 3–5 lb | 1.4–2.3 kg | – | – |
| Cabbage | 12–18 in (30–46 cm) | 10–25 lb | 4.5–11.3 kg | 150 lb | 68.0 kg |
| Carrots | thinned to 1.5–2 in (3.8–5 cm) | 7–10 lb | 3.2–4.5 kg | 100 lb | 45.4 kg |
| Cauliflower | 12–24 in (30–61 cm) | 8–10 lb | 3.6–4.5 kg | 80 lb | 36.3 kg |
| Chard | 6–12 in (15–30 cm) | 8–12 lb | 3.6–5.4 kg | 75 lb | 34.0 kg |
| Collards and kale | 12–24 in (30–61 cm) | 4–8 lb | 1.8–3.6 kg | 150 lb | 68.0 kg |
| Cucumbers | 12–18 in (30–46 cm) | 8–10 lb | 3.6–4.5 kg | 100 lb | 45.4 kg |
| Aubergine (eggplant) | 18–24 in (46–61 cm) | 10–12 lb | 4.5–5.4 kg | 150 lb | 68.0 kg |
| Leeks | 4–6 in (10–15 cm) | 5–10 lb | 2.3–4.5 kg | – | – |
| Lettuce, head | 6–10 in (15–25 cm) | 2–4 lb | 0.91–1.8 kg | 75 heads | – |
| Lettuce, leaf or baby salad | 0.2–0.4 in (0.5–1 cm) | 2–4 lb | 0.91–1.8 kg | 50 lb (leaf lettuce at 8–12 in, 20–30 cm) | 22.7 kg |
| Onions, bulb | 2–4 in (5–10 cm) | 7–10 lb | 3.2–4.5 kg | 100 lb | 45.4 kg |
| Peas, garden | 2–3 in (5–7.6 cm) | 2–6 lb | 0.91–2.7 kg | 30 lb in shell | 13.6 kg in shell |
| Peppers (bell) | 12–24 in (30–61 cm) | 5–18 lb | 2.3–8.2 kg | 150 lb | 68.0 kg |
| Potatoes | 10–18 in (25–46 cm) | 10–20 lb | 4.5–9.1 kg | 150 lb | 68.0 kg |
| Pumpkin | 2–4 ft (61–122 cm) | 10–20 lb | 4.5–9.1 kg | 300 lb | 136.1 kg |
| Radish | ¾–1 in (1.9–2.5 cm) | 3–5 lb | 1.4–2.3 kg | 40 lb | 18.1 kg |
| Spinach | 0.5–1 in, thinned to 4 in (1.3–2.5 cm, thinned to 10 cm) | 4–6 lb | 1.8–2.7 kg | 70 lb | 31.8 kg |
| Summer squash (courgette) | 18–36 in (46–91 cm) | 20–80 lb | 9.1–36.3 kg | 150 lb | 68.0 kg |
| Sweet potato | 9–12 in (23–30 cm) | 8–12 lb | 3.6–5.4 kg | 100 lb | 45.4 kg |
| Sweetcorn | 6–12 in (15–30 cm) | 7–10 lb | 3.2–4.5 kg | 120 ears | – |
| Tomatoes | 18–36 in (46–91 cm) | 15–45 lb | 6.8–20.4 kg | 125 lb | 56.7 kg |
| Turnips | 2–3 in (5–7.6 cm) | 8–12 lb | 3.6–5.4 kg | 50–100 lb (roots) | 22.7–45.4 kg |
| Winter squash | 2–4 ft (61–122 cm) | 10–80 lb | 4.5–36.3 kg | 100 lb | 45.4 kg |
Mississippi State’s per-100-ft figures can be divided by 10 for a rough per-10-ft comparison. For cabbage, that gives 15 lb per 10 ft, which sits inside Virginia’s 10 to 25 lb range. For kale and collards, Mississippi’s 150 lb per 100 ft works out at 15 lb per 10 ft (at a closer spacing of 8 to 16 in, or 20 to 41 cm), about two to four times Virginia’s 4 to 8 lb.
Soft fruit yield per plant and per bush
Soft fruit figures are for mature, established plants. Missouri Extension says its higher figures represent the most productive cultivars in their most productive years. The RHS, the UK’s main gardening charity, gives its figures in kilograms and notes that they are a rough guide because fruit yield depends heavily on the year’s weather.
| Fruit | Missouri Extension G6005 (2017), per mature plant | NC State Extension (2022), average per plant per year | RHS (UK), per mature plant or bush |
|---|---|---|---|
| Blackcurrant | Currant: 5–10 lb (2.3–4.5 kg) | – | 4.5 kg (9.9 lb) per bush |
| Red and white currant | Currant: 5–10 lb (2.3–4.5 kg) | – | 4.5 kg (9.9 lb) per bush |
| Gooseberry | 4–7 lb (1.8–3.2 kg) | – | 3.5 kg (7.7 lb) per bush |
| Raspberry | 45–75 lb (20.4–34.0 kg) per 50-ft (15.2 m) row | Red and black: 2–4 lb (0.91–1.8 kg) | 1–1.5 kg (2.2–3.3 lb) per plant |
| Blackberry | 60–100 lb (27.2–45.4 kg) per 50-ft (15.2 m) row | Erect: 4 lb (1.8 kg). Semi-trailing: 20 lb (9.1 kg) | 2 kg (4.4 lb) per plant |
| Blueberry | 5–15 lb (2.3–6.8 kg) | Highbush: 8 lb (3.6 kg). Rabbiteye: 12 lb (5.4 kg) | 2–4.5 kg (4.4–9.9 lb) per bush |
| Strawberry | 30–65 lb (13.6–29.5 kg) per 50-ft (15.2 m) row | June-bearing: ½ lb (0.23 kg). Everbearing: ⅓ lb (0.15 kg) | 0.5–1 kg (1.1–2.2 lb) per plant |
University of Minnesota Extension (2026) gives ⅓ lb (0.15 kg) per day-neutral strawberry plant in the field and 1 lb (0.45 kg) in a high tunnel. NC State Extension (2022) notes that currants and gooseberries cannot legally be grown in North Carolina, so its table has no figures for them. The RHS’s blackcurrant growing guide gives the same figure as its chart: an established bush should produce about 10 lb (4.5 kg) of currants.
The RHS’s strawberry figure (1.1 to 2.2 lb, or 0.5 to 1 kg, per plant) is two to four times NC State Extension’s (½ lb, or 0.23 kg).
Garden yield per square foot: what measured gardens produce
Whole-garden studies weigh everything a garden produces and divide by its area. The result depends on what counts as area: the ground under crops, the whole bed, or the whole plot including paths and sheds. The US and Canadian studies below are small samples from single cities. The UK studies are larger.
| Study (place, years) | Who was measured | Yield, lb per sq ft | Yield, kg/m² |
|---|---|---|---|
| Algert et al. (2014) (San Jose, California, 2012) | 10 community gardeners | Mean 0.75, range 0.45–1.13 | 3.66, range 2.20–5.52 |
| Conk and Porter (2016) (Laramie, Wyoming, 2012–2014) | Community and home garden plots, average 253 sq ft (23.5 m²) | 0.51, single plots from 0.01 to 2.06 | 2.49, single plots from 0.05 to 10.06 |
| CoDyre et al. (2015) (Guelph, Canada, 2012) | 50 gardeners (68% backyard, 28% allotment or community, 4% both) | Mean 0.29, range 0.02–1.06 | Mean 1.43, range 0.08–5.18 |
| MYHarvest, Gulyas (2023) (UK, 2017–2022) | Allotments and gardens; mean of per-crop yields on the ground each crop occupied, 39 crops including tree fruit | Mean 0.40 | Mean 1.93 per year |
| Edmondson et al. (2020) (UK own-growers, 2012–2013) | 240 crop yields from 80 growing sites | Mean 0.47 | Mean 2.3 ± 0.2 |
| Edmondson et al. (2020) (Leicester, UK) | All allotment land in the city, including unused plots and uncultivated ground | About 0.33 | About 1.6 |
| Gulyas and Edmondson (2024) (UK, food diaries of at least 42 weeks, returned by February 2022) | 85 food-growing households, total cultivated area | Median 0.29 | Median 1.4 per year |
Algert et al. (2014) and Conk and Porter (2016) reported in lb per sq ft. CoDyre et al. (2015) and the UK studies reported in kg/m². The other column in each row is a conversion.
In Laramie, the average 253 sq ft (23.5 m²) plot yielded 128 lb (58.1 kg) of produce a season (Conk and Porter, 2016). That harvest was enough to supply one adult with the USDA-recommended daily amount of vegetables for about 9 months.
The top 10% of Guelph backyard gardeners averaged 0.86 lb per sq ft (4.18 kg/m²), nearly three times the sample mean of 0.29 lb per sq ft (1.43 kg/m²) (CoDyre et al., 2015).
In the UK household diary study, the median household grew 361 lb (163.6 kg) of produce a year across allotment and garden (Gulyas and Edmondson, 2024). The median UK allotment produced 334 lb (151.6 kg) a year, and the median home garden produced 53 lb (23.9 kg). The median total cultivated area was 1,297 sq ft (120.5 m²).
In Leicester, surveyed allotment plots averaged about 2,840 sq ft (264 ± 15 m²), and on average 51.5% of each plot was under cultivation (Edmondson et al., 2020). The citywide figure (1.6 kg/m²) is spread over all allotment land in the city, including unused plots and uncultivated ground within plots, which is part of why it is lower than the 2.3 kg/m² mean crop yield. Cultivating the city’s unused plots to the same 51.5% would raise Leicester’s allotment productivity to 1.8 kg/m², or 0.37 lb per sq ft (Edmondson et al., 2020).
Yield per square foot by crop: UK allotment and garden data
The largest measured per-crop dataset I found comes from the UK, so it is the source for this section. None of the US studies I checked report measured yields crop by crop. The MYHarvest citizen science project, run by the University of Sheffield and launched in April 2017 (Edmondson et al., 2019), asked UK growers to weigh each harvest and record the area each crop grew on. The analysis below covers five growing years, March 2017 to February 2022. The study covers home gardens and allotments, which are plots of land of about 2,700 sq ft (250 m²) rented to individuals for growing crops (Gulyas and Edmondson, 2024).
Two figures are given for each crop. The mean comes from Gulyas (2023), Table S8: a bootstrapped mean from the study’s mixed-effects models, with its 95% confidence interval. The median and interquartile range are Leaftide’s own summary of the open MYHarvest dataset (Gulyas et al., 2025, CC BY 4.0). The median shows the middle record (one crop on one growing area in one year), and the interquartile range shows where the middle half of records fell. One grower can contribute many records.
The MYHarvest analysis excluded failed crops, so all these figures assume the crop produced something. Some crops at the top of the table were often grown under glass: 93 of 189 cucumber records, 280 of 569 tomato records and 63 of 95 pepper records came from a greenhouse or polytunnel.
Vegetables
| Vegetable | Mean, lb per sq ft | Mean, kg/m²/yr (95% CI) | Median, lb per sq ft | Median, kg/m²/yr (middle half) | Records |
|---|---|---|---|---|---|
| Cucumber (49% of records under glass) | 1.39 | 6.81 (5.22–9.59) | 1.30 | 6.34 (2.15–15.84) | 189 |
| Courgette (zucchini) | 0.98 | 4.78 (4.04–5.72) | 0.99 | 4.84 (2.31–8.71) | 461 |
| Tomato (49% of records under glass) | 0.94 | 4.57 (3.90–5.01) | 0.98 | 4.77 (2.18–10.16) | 569 |
| Runner beans | 0.78 | 3.81 (3.18–4.67) | 0.74 | 3.61 (1.96–6.39) | 314 |
| Pepper (66% of records under glass) | 0.67 | 3.27 (2.40–4.57) | 0.44 | 2.13 (0.74–4.42) | 95 |
| Spinach | 0.60 | 2.94 (1.30–6.12) | 0.31 | 1.50 (0.78–3.58) | 75 |
| Squash and pumpkin | 0.54 | 2.65 (2.20–3.15) | 0.58 | 2.84 (1.23–5.48) | 270 |
| Potato | 0.50 | 2.45 (2.27–2.68) | 0.55 | 2.68 (1.47–4.50) | 814 |
| Beetroot | 0.49 | 2.38 (2.12–2.67) | 0.56 | 2.73 (1.25–5.34) | 344 |
| Carrot | 0.46 | 2.27 (1.82–3.20) | 0.47 | 2.30 (1.07–4.99) | 315 |
| Parsnip | 0.44 | 2.14 (1.84–2.51) | 0.53 | 2.58 (1.10–4.63) | 204 |
| Cabbage | 0.36 | 1.76 (1.46–2.17) | 0.40 | 1.97 (0.86–3.52) | 302 |
| Chard | 0.36 | 1.76 (1.21–2.55) | 0.33 | 1.63 (0.57–3.15) | 86 |
| French and climbing beans | 0.35 | 1.73 (1.51–2.01) | 0.39 | 1.90 (0.92–3.52) | 424 |
| Turnips and swedes | – | not reported | 0.32 | 1.54 (0.87–3.47) | 128 |
| Radish | 0.31 | 1.53 (1.08–2.12) | 0.30 | 1.47 (0.78–2.75) | 60 |
| Broad beans | 0.31 | 1.49 (1.26–1.79) | 0.29 | 1.44 (0.70–2.85) | 319 |
| Onion | 0.30 | 1.47 (1.30–1.64) | 0.34 | 1.67 (0.91–3.12) | 452 |
| Jerusalem artichoke | 0.30 | 1.46 (1.16–1.82) | 0.29 | 1.42 (0.74–3.19) | 14 |
| Cauliflower | 0.28 | 1.38 (1.02–1.85) | 0.26 | 1.29 (0.55–2.50) | 61 |
| Lettuce and salad leaves | 0.26 | 1.26 (1.03–1.60) | 0.28 | 1.35 (0.51–2.57) | 361 |
| Sweetcorn | 0.22 | 1.09 (0.94–1.23) | 0.24 | 1.18 (0.67–2.00) | 203 |
| Peas | 0.20 | 0.97 (0.83–1.13) | 0.20 | 0.99 (0.50–2.10) | 370 |
| Garlic | 0.19 | 0.92 (0.75–1.14) | 0.18 | 0.86 (0.50–1.52) | 134 |
| Leek | 0.18 | 0.90 (0.77–1.06) | 0.22 | 1.06 (0.43–2.30) | 286 |
| Brussels sprouts | 0.18 | 0.86 (0.63–1.30) | 0.17 | 0.82 (0.34–1.73) | 113 |
| Kale | 0.17 | 0.81 (0.60–1.11) | 0.17 | 0.82 (0.28–1.57) | 115 |
| Broccoli | 0.13 | 0.62 (0.49–0.79) | 0.15 | 0.73 (0.25–1.25) | 191 |
| Asparagus | 0.10 | 0.47 (0.35–0.63) | 0.09 | 0.44 (0.25–1.33) | 67 |
Soft fruit and rhubarb
| Crop | Mean, lb per sq ft | Mean, kg/m²/yr (95% CI) | Median, lb per sq ft | Median, kg/m²/yr (middle half) | Records |
|---|---|---|---|---|---|
| Blackberry | 0.66 | 3.23 (2.00–5.93) | 0.29 | 1.44 (0.66–3.02) | 78 |
| Rhubarb | 0.55 | 2.70 (2.10–3.39) | 0.51 | 2.50 (1.27–4.71) | 154 |
| Blueberry | 0.47 | 2.30 (1.18–4.90) | 0.16 | 0.80 (0.46–1.40) | 61 |
| Gooseberry | 0.33 | 1.61 (1.39–1.87) | 0.29 | 1.43 (0.65–3.08) | 264 |
| Currant | 0.23 | 1.11 (0.96–1.28) | 0.22 | 1.06 (0.52–2.07) | 329 |
| Strawberry | 0.17 | 0.81 (0.67–1.00) | 0.18 | 0.90 (0.42–1.81) | 327 |
| Raspberry | 0.15 | 0.75 (0.63–0.91) | 0.18 | 0.90 (0.40–1.75) | 338 |
For most crops, the modelled mean and the raw median agree within about 0.1 lb per sq ft (0.5 kg/m²). Pepper, spinach, blueberry and blackberry are the exceptions, with means well above their medians. The blueberry mean (0.47 lb per sq ft, 2.30 kg/m²) is almost three times the median (0.16 lb per sq ft, 0.80 kg/m²), and the blackberry mean (0.66 lb per sq ft, 3.23 kg/m²) is more than twice the median (0.29 lb per sq ft, 1.44 kg/m²). For those four crops, the median is the safer figure to plan with.
Across all 39 crops, including apples, pears and plums, MYHarvest per-crop yields averaged 0.40 lb per sq ft, or 1.93 kg/m² per year (±0.06 SE) (Gulyas, 2023). Weighting each crop by the share of allotment ground it occupies gives 0.42 lb per sq ft, or 2.04 kg/m² per year (±0.05 SE).
What makes vegetable yields vary
Each factor below has a measured effect in at least one study.
Climate and season length
University of Wisconsin Extension (2017) gives 12 to 15 lb (5.4 to 6.8 kg) per tomato plant in southern and central Wisconsin, against 7 to 9 lb (3.2 to 4.1 kg) in the north of the state. In the UK MYHarvest study, each 1°C (1.8°F) rise in mean growing-season temperature, from 13 to 14°C (55.4 to 57.2°F), was linked to 0.38 kg/m² (±0.13 SE) more potatoes and 0.53 kg/m² (±0.21 SE) more broad beans per year (Gulyas, 2023).
Protection
University of Minnesota Extension (2026) expects 2 to 6 lb (0.9 to 2.7 kg) per field tomato plant and 8 to 20 lb (3.6 to 9.1 kg) per high-tunnel plant. In the UK MYHarvest study, a greenhouse raised tomato yields by 0.95 kg/m² (±0.31 SE) and strawberry yields by 1.11 kg/m² (±0.67 SE) per year, but had no significant effect on cucumbers or lettuce (Gulyas, 2023).
Variety
In one Ohio State University trial in 2012, eight fresh-market tomato cultivars grown on the same site under the same management gave between 3.65 and 11.66 lb (1.7 to 5.3 kg) of marketable fruit per plant.
Plant density
In runner bean spacing trials reported by Bleasdale and Salter (1991), raising the population from 1.4 to 21 plants per square metre (0.13 to 2.0 per sq ft) increased yield from 2.2 to 5 kg/m² (4 to over 9 lb per square yard). In the same trials, two plants per cane yielded about 10 to 20% less than the same number of plants spaced singly. The plant spacing guide covers spacing crop by crop.
Soil
In the UK MYHarvest study, currant yields were 0.57 kg/m² per year lower (±0.13 SE) on loamy lime soils than on loamy acidic soils (Gulyas, 2023). In the same study, leek yields were 0.49 kg/m² lower (±0.16 SE) on loamy soils with high groundwater, and broccoli yields were 0.49 kg/m² lower (±0.13 SE) on peaty soils.
Experience
In Guelph, gardeners with more than seven years of experience were significantly more productive than less experienced gardeners (p < 0.05), and all but one of the top 10% had seven or more years of experience (CoDyre et al., 2015). In the UK household study, yield rose by 0.02 kg/m² per year (±0.01) for each extra year of growing experience (Gulyas and Edmondson, 2024).
Plot size
In the UK household study, yield fell by 0.005 kg/m² per year (±0.001) for each extra square metre of cultivated area, so larger gardens produced less per square metre (Gulyas and Edmondson, 2024).
The year itself
In Laramie, plots measured in more than one season varied by an average of 39% in yield rate from one year to the next (Conk and Porter, 2016). The RHS warns that soft fruit yield is very dependent on the year’s weather.
What did not matter much
In the UK MYHarvest study, whether a crop grew on an allotment, in a garden or in another space had no significant effect on yield for any of the 25 crops modelled (Gulyas, 2023). Organic growing had no significant effect on 24 of the 25 crops modelled. Broccoli was the exception, where organic growing was linked to 0.22 kg/m² more yield per year (±0.11 SE).
Do gardeners out-yield farms?
For some crops, yes. In Guelph, Ontario, backyard cucumbers yielded 0.74 lb per sq ft (3.63 kg/m²), against 0.49 lb per sq ft (2.41 kg/m²) in conventional Ontario cucumber fields (CoDyre et al., 2015). Backyard tomatoes in the same study yielded 0.58 lb per sq ft (2.85 kg/m²), against 1.57 lb per sq ft (7.68 kg/m²) in the tomato fields of Chatham-Kent, Ontario.
In the five-year UK MYHarvest analysis, own-grown yields were higher than UK commercial field yields for asparagus, broad beans, cauliflower, courgette, peas and runner beans (Gulyas, 2023). Commercial field yields were higher for beetroot, broccoli, Brussels sprouts, cabbage, carrots, leeks, lettuce, onions, parsnips, potatoes, raspberries, strawberries, apples and plums. Commercial yields were higher for every protected crop compared: cucumber, lettuce, pepper and tomato.
The earlier 2012 to 2013 UK dataset found own-growers ahead of commercial growers for French beans, runner beans, currants, leeks and raspberries, and behind for tomatoes, carrots and cabbages (Edmondson et al., 2020). The two UK studies disagree on leeks and raspberries.
Edmondson et al. (2020) cite a commercial courgette yield of 1.9 kg/m² (0.39 lb per sq ft) (Knapp and Osborne, 2017), about 4 kg/m² (0.8 lb per sq ft) below the average courgette yield their own-growers recorded.
Comparing your own garden
The most useful number is your own, measured the same way each year. The MYHarvest method is simple to copy: weigh every harvest of a crop across the year, measure the area that crop occupied, and divide. Comparing your figures against the per-square-foot tables above tells you whether a bed is doing well for your climate, or whether its space would feed you better with something else.
If you log harvests in Leaftide, each harvest is dated against the plant and its variety, so a season’s records can be compared variety by variety. The harvest tracking guide covers what to record without turning it into a chore.
Frequently asked questions
How much does a tomato plant produce?
University of Minnesota Extension (reviewed 2026) expects 2 to 6 lb (0.9 to 2.7 kg) per field-grown slicing or Roma tomato plant and 8 to 20 lb (3.6 to 9.1 kg) per plant in a high tunnel. University of Wisconsin Extension (2017) says gardeners in southern and central Wisconsin can expect 12 to 15 lb (5.4 to 6.8 kg) per plant, and 7 to 9 lb (3.2 to 4.1 kg) in northern Wisconsin. In a 2012 Ohio State University trial, eight fresh-market cultivars grown side by side gave between 3.65 and 11.66 lb (1.7 to 5.3 kg) of marketable fruit per plant.
How much does a 10 ft row of vegetables produce?
Virginia Cooperative Extension (2025) gives approximate yields per 10-ft (3.05 m) row: 15 to 45 lb (6.8 to 20.4 kg) of tomatoes, 10 to 20 lb (4.5 to 9.1 kg) of potatoes, 7 to 10 lb (3.2 to 4.5 kg) of carrots, 3 to 5 lb (1.4 to 2.3 kg) of bush beans and 20 to 80 lb (9.1 to 36.3 kg) of summer squash. The figures assume the in-row spacings given in the same table.
How many pounds of vegetables does a garden produce per square foot?
Measured gardens in the US produced about half a pound to three quarters of a pound per square foot. Community and home garden plots in Laramie, Wyoming averaged 0.51 lb per sq ft (2.49 kg/m²) over 2012 to 2014 (Conk and Porter, 2016). Ten San Jose community gardeners averaged 0.75 lb per sq ft (3.66 kg/m²) in 2012 (Algert et al., 2014). In the UK, the University of Sheffield MYHarvest project measured each crop separately, on the ground that crop occupied for a year, rather than whole gardens. Across 39 crops, including tree fruit, those per-crop yields averaged 0.40 lb per sq ft (1.93 kg/m²) a year, 2017 to 2022 (Gulyas, 2023).
Which vegetables give the most food per square foot?
In the UK MYHarvest data (2017 to 2022), the highest mean yields were cucumber at 1.39 lb per sq ft (6.81 kg/m²) a year, courgette or zucchini at 0.98 lb (4.78 kg/m²), tomato at 0.94 lb (4.57 kg/m²), runner beans at 0.78 lb (3.81 kg/m²) and peppers at 0.67 lb (3.27 kg/m²) (Gulyas, 2023, Table S8). The lowest were asparagus at 0.10 lb per sq ft (0.47 kg/m²), broccoli at 0.13 lb (0.62 kg/m²), kale at 0.17 lb (0.81 kg/m²) and Brussels sprouts at 0.18 lb (0.86 kg/m²). In the MYHarvest records, about half the cucumbers and tomatoes and about two thirds of the peppers were grown in a greenhouse or polytunnel.
How much fruit does a blueberry, raspberry or currant bush produce?
Missouri Extension (2017) gives 5 to 15 lb (2.3 to 6.8 kg) per mature blueberry plant, 5 to 10 lb (2.3 to 4.5 kg) per currant and 4 to 7 lb (1.8 to 3.2 kg) per gooseberry. NC State Extension (2022) gives an average of 8 lb (3.6 kg) a year per highbush blueberry and 2 to 4 lb (0.9 to 1.8 kg) per red or black raspberry plant. The RHS says an established blackcurrant bush should produce about 4.5 kg (10 lb) of fruit.
Do home gardeners get lower yields than farms?
Not always. Backyard cucumbers in Guelph, Ontario yielded 3.63 kg/m² (0.74 lb per sq ft) against 2.41 kg/m² (0.49 lb per sq ft) in conventional Ontario fields, while backyard tomatoes yielded 2.85 kg/m² against 7.68 kg/m² (CoDyre et al., 2015). In the UK MYHarvest study, own-grown yields beat commercial field yields for asparagus, broad beans, cauliflower, courgette, peas and runner beans, but not for most other crops (Gulyas, 2023).
Methodology and gaps
Expected versus measured
The per-plant and per-row tables are expected yields published for planning. The per-square-foot tables and the whole-garden table are measured yields from people who weighed their harvests. The two kinds of figure should not be averaged together.
MYHarvest figures
The means are taken unchanged from Gulyas (2023), Supplementary Table S8, which models yield with site as a random effect and soil, temperature, growing method and space type as fixed effects. The text of that thesis refers to 39 crop types, but Table S8 lists 38. Leaftide’s medians come from the open dataset (Gulyas et al., 2025). The dataset file repeats each crop’s annual total once for every harvest logged, so each crop, growing area and year was counted once: 10,638 records from 452 growers. Records with zero weight were absent from the dataset. Tree fruit (apple, pear, plum and trained forms) and loganberry are left out of these tables to keep the page on vegetables and soft fruit.
Conversions
Pounds were converted at 0.4536 kg per lb, kg/m² to lb per sq ft at 0.2048 (1 lb per sq ft is 4.88 kg/m²), and 10 ft is 3.05 m. Converted values are rounded and are not more precise than the source.
Figures not included
I could not find a source that I could open and check for these, so they are left out:
- Yield per plant for potatoes, onions, carrots, beetroot, leeks, peas, beans, lettuce and garlic. University of Minnesota Extension’s onion per-plant figure is partly unreadable on its page, so it is not used.
- A UK extension-style expected yield per row for vegetables. UK yields on this page are measured MYHarvest yields.
- An MYHarvest mean for turnips and swedes (the dataset has records, but Table S8 gives no modelled mean).
- Commercial UK yields per crop. Gulyas (2023) and Edmondson et al. (2020) compare against Defra statistics, but only in charts, so the commercial values are not reproduced here.
Sources
- Hoidal, N. University of Minnesota Extension (reviewed 2026). “Crop and field planning tools for vegetable farmers.” extension.umn.edu/agriculture/specialty-crops/vegetable-farming/crop-and-field-planning-tools-for-vegetable-farmers
- Sánchez, E. Penn State Extension (updated 22 December 2025). “Crop Yield Estimates for Vegetables.” extension.psu.edu/crop-yield-estimates-for-vegetables
- Jadrnicek, S. and Hessler, A. Virginia Cooperative Extension (2025). “Virginia’s Home Garden Vegetable Planting Guide: Recommended Planting Dates and Amounts to Plant.” Publication 426-331 (SPES-673P), Table 5. pubs.ext.vt.edu/426/426-331/426-331.html
- Mississippi State University Extension (2025). Mississippi Vegetable Gardener’s Guide. Publication 3616, Table 1. extension.msstate.edu/sites/default/files/publications/P3616_web.pdf
- Krokowski, K. University of Wisconsin Extension (2017). Homegrown Tomatoes for Wisconsin. A1691. hort.extension.wisc.edu/articles/home-grown-tomatoes-wisconsin/
- Bergefurd, B.R. et al. Ohio State University South Centers (2012). “Fresh Market Tomato Cultivar Performance Trial Grown in Southern Ohio 2012.” southcenters.osu.edu
- Fernandez, G. et al. NC State Extension (2022). North Carolina Extension Gardener Handbook, Chapter 14, “Small Fruits,” Table 14–1. content.ces.ncsu.edu/extension-gardener-handbook/14-small-fruits
- Warmund, M. University of Missouri Extension (2017, reviewed 2022). “Fruit Cultivars for Home Plantings.” G6005, Table 1. extension.missouri.edu/publications/g6005; PDF: extension.missouri.edu/media/wysiwyg/Extensiondata/Pub/pdf/agguides/hort/g06005.pdf
- Algert, S.J., Baameur, A. and Renvall, M.J. (2014). “Vegetable output and cost savings of community gardens in San Jose, California.” Journal of the Academy of Nutrition and Dietetics 114(7): 1072–1076. doi.org/10.1016/j.jand.2014.02.030
- Conk, S.J. and Porter, C.M. (2016). “Food gardeners’ productivity in Laramie, Wyoming: more than a hobby.” American Journal of Public Health 106(5): 854–856. doi.org/10.2105/AJPH.2016.303108
- CoDyre, M., Fraser, E.D.G. and Landman, K. (2015). “How does your garden grow? An empirical evaluation of the costs and potential of urban gardening.” Urban Forestry & Urban Greening 14(1): 72–79. doi.org/10.1016/j.ufug.2014.11.001
- Gulyas, B.Z. (2023). The contribution of urban horticulture to food security, resilience and health and well-being. PhD thesis, University of Sheffield. Chapter 3, “Measure Your Harvest: insights from a long-term study on the contribution of own-growing to food security in the UK”; Supplementary Table S8 and Table 3. etheses.whiterose.ac.uk/id/eprint/33157/
- Gulyas, B., Blevins, R., Caton, S., Cunningham, H., Crispo, M., Catterall, A., Dobson, M., Edmondson, M., Edmondson, S., Leake, J. and Edmondson, J. (2025). Measure Your Harvest: long-term citizen-science reveals the contribution of own-growing to UK food security, dataset. University of Sheffield. CC BY 4.0. doi.org/10.15131/shef.data.30675815
- Edmondson, J.L., Childs, D.Z., Dobson, M.C., Gaston, K.J., Warren, P.H. and Leake, J.R. (2020). “Feeding a city: Leicester as a case study of the importance of allotments for horticultural production in the UK.” Science of the Total Environment 705: 135930. doi.org/10.1016/j.scitotenv.2019.135930
- Edmondson, J.L., Blevins, R.S., Cunningham, H., Dobson, M.C., Leake, J.R. and Grafius, D.R. (2019). “Grow your own food security? Integrating science and citizen science to estimate the contribution of own growing to UK food production.” Plants, People, Planet 1(2): 93–97. doi.org/10.1002/ppp3.20
- Gulyas, B.Z. and Edmondson, J.L. (2024). “The contribution of household fruit and vegetable growing to fruit and vegetable self-sufficiency and consumption.” Plants, People, Planet 6(1): 162–173. doi.org/10.1002/ppp3.10413
- Royal Horticultural Society. “Fruit production chart.” rhs.org.uk/advice/pdfs/fruitproductionchart.pdf; and “How to grow blackcurrants.” rhs.org.uk/fruit/blackcurrants/grow-your-own
- Bleasdale, J.K.A. and Salter, P.J. (1991). The Complete Know and Grow Vegetables. Oxford University Press. Chapter 1, “Space to grow,” runner beans, pp. 24–25.
Cite this data
Leaftide’s compilation, article text and MYHarvest median summaries are published under Creative Commons Attribution 4.0 (CC BY 4.0). The underlying MYHarvest dataset is also CC BY 4.0. Figures from extension services, the RHS and journal articles remain attributed to those sources and are not relicensed.
How to cite: Leaftide (2026). “Vegetable Garden Yields per Plant, Row and Square Foot.” Retrieved from https://leaftide.com/learn/vegetable-garden-yields/. Expected yields from US extension services (Minnesota, Penn State, Virginia Tech, Mississippi State, Wisconsin, Ohio State, NC State, Missouri). Measured UK yields from MYHarvest (Gulyas 2023; Gulyas et al. 2025, University of Sheffield).
Last updated: 21 October 2026.
For related reference data, see days to maturity for vegetables, the plant spacing guide and succession planting schedules.