The moment charts stopped making sense
Every seed packet I bought said something like “Sow Mar–Jun.” It looked helpful at first, until I tried to work out what that meant for me. Was early March too soon? Would late April be too late? The charts gave neat ranges, but they never explained how those dates shift depending on where you live or how you grow.
Online guides added more uncertainty. They said you can start tomatoes in January if you have grow lights or a heated propagator, but none of them explained what that actually means in practice. How soon is too soon. How much do those things really change the calendar.
When I bought my first grow lights, I decided to test it. I sowed tomatoes in mid January, thinking I was being clever. The seedlings shot up fast but turned leggy because I couldn’t move them outside. Daylight was short, my windowsill stayed cold, and they stalled for weeks. It made me realise the advice wasn’t exactly wrong, but it wasn’t specific enough to be useful. There was no real guidance on how these tools interact with the climate you actually live in.
I like to plan things and see how different choices affect the outcome. But with sowing charts, there was no way to do that. You were left to guess. That was the point when I started building something that could give real, predicted dates for my own garden. I wanted something that connects your setup to your local weather instead of following a generic chart.
From guessing to seeing real dates
In Leaftide, I can now see an ideal sowing window for the setup I’ve chosen. Instead of a vague range like “Mar–Jun,” it gives a clear start and end date that fit the climate and growing conditions. It also builds a short timeline that predicts when I’ll transplant and when the first harvest is likely to arrive.
The point is not to make a perfect forecast. It is to give you a sense of how things will unfold in your situation. If I change a detail, for example switch from a bed to a container or turn on grow lights, I can see how the window moves. The system also shows a short note explaining why. That feedback loop helps me understand timing in a way that a static chart never could.
I built this partly for myself because I wanted to stop guessing. I wanted a clear way to test ideas and see cause and effect. But it turned into something broader. It became a tool that shows how your environment and setup change the calendar in small but important ways.
How it figures out the dates
Leaftide uses a few simple pieces of information to make its predictions. You set your location and choose where the plant will live, a bed, a container, or somewhere sheltered. You can also tell it if you will use grow lights or heat.
With that, it looks at local frost risk to find a safe starting point. It also checks day length, because very early starts spend weeks growing slowly in short daylight. Then it uses a simple soil temperature signal to plan the transplant stage, and something called growing degree days to estimate how fast the plant will reach each stage after that.
Growing degree days are just a running total of warmth. Each day adds a bit if it is warm enough for growth. When that total reaches what a crop needs for a certain stage, that stage usually happens. It is a simple idea, but it explains a lot of what gardeners notice. The plants that start later often catch up to the ones that started early. Warmer, brighter days make the counter rise faster, so development evens out. Leaftide uses that pattern to keep the timing realistic.
What it looks like when you use it
When I open a plan, I get a suggested sowing date inside my ideal window. The timeline shows the next stages, sow, transplant, and first harvest, as broad ranges rather than fixed dates. If I tweak a setting, the chart updates instantly and the short “because” notes tell me why. It is a small thing, but it makes the growing season easier to plan and understand.
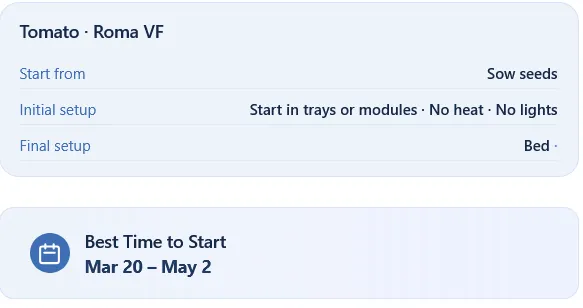
The ideal sowing window adjusts based on your location and growing setup
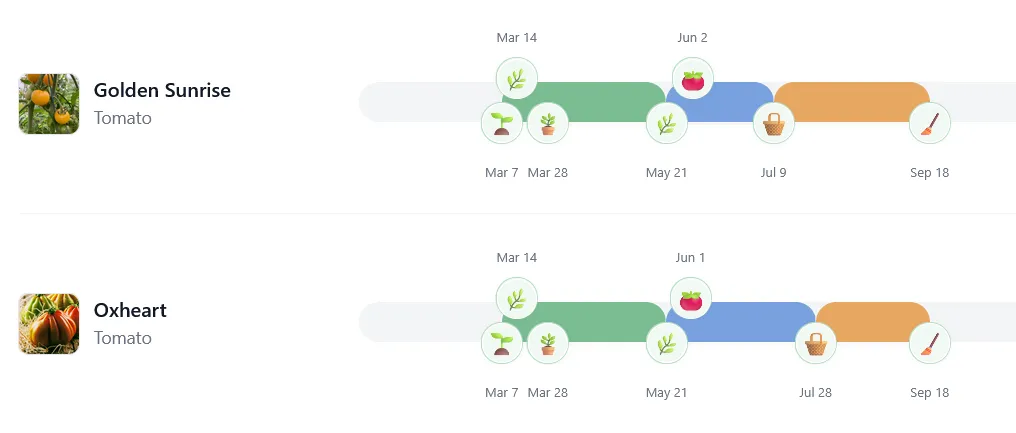
Timeline showing when each stage is predicted to happen
What the predictions show in practice
To see how this plays out, take the same tomato variety grown two different ways: direct sowing outdoors or starting seeds early in a heated propagator.
Example 1: Direct sown outdoors
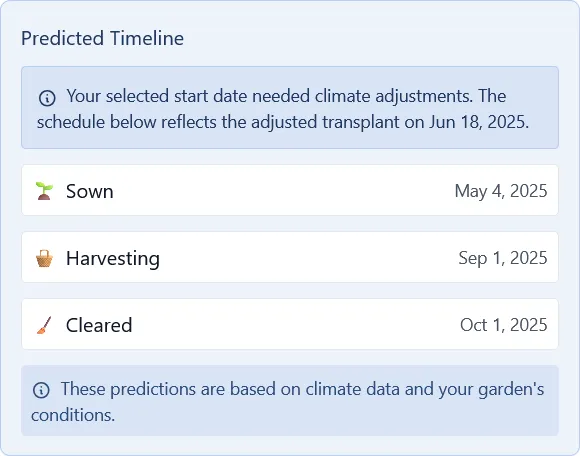
Direct sown outdoors: sowing in early May leads to September harvest
Example 2: Started early in a propagator
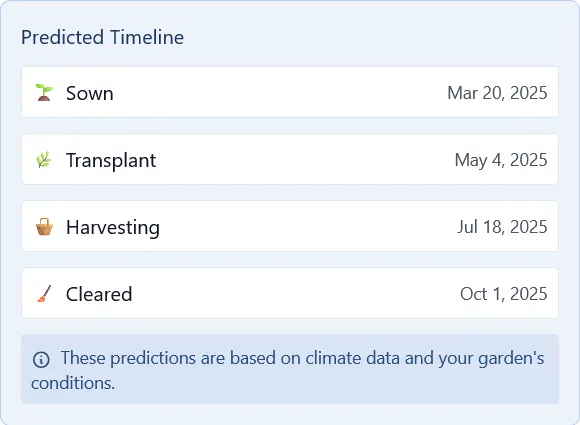
Started indoors: sowing in late March brings harvest forward to mid-July
The difference is clear. Starting seeds indoors gives a head start of six weeks, pushing the first harvest from September back to mid-July. The outdoor-sown plants still reach the same clearing date, but they spend more of their season producing fruit instead of just growing.
Seeing both timelines side by side makes those trade-offs obvious. You can adjust the start date or change the setup and immediately see how the harvest window shifts. It turns the usual vague advice about “early” or “late” into something you can measure and plan around.
Why later seedlings often catch up
Gardeners often say that seedlings started later can catch up to the ones sown early. The model shows why this happens.
Early seedlings grow slowly through short, cool days, so the total warmth they collect adds up slowly. Later seedlings start when the days are longer and warmer, so the warmth total climbs much faster. When both reach the same total, they reach the same stage, even if one had a head start.
This pattern appears clearly when you plot growing degree days over time. The line for the early sowing rises gradually, while the line for the later one climbs more steeply and meets it halfway through the season. It is a simple explanation that matches what gardeners already see in real life.
Understanding the limits
Everything in the system comes from historical weather and long-term climate patterns. That means it can show what usually happens, but it cannot tell you what will happen this year. Real seasons drift from the averages. A warm spring or a late frost can shift the results either way.
Leaftide tries to make that clear by showing a confidence range, not a single date. The width of that range depends on how stable your local data is. In places with good weather records, the range is narrow. In areas with few stations or strong microclimates, it becomes wider. Pots and containers also swing faster in temperature than beds, which adds a bit more uncertainty.
The idea is not to remove uncertainty but to make it visible. Seeing how wide the window is helps you decide how much to trust an early start or whether to wait for a safer point in the season.
What this changes for planning
Once you have real dates, the rest of planning becomes easier. You can time seed orders, prepare space for seedlings, or plan when to clear old crops from a bed. You can also test what happens if you start a little earlier or later and see the impact before you commit.
This approach turns sowing from guesswork into a visible timeline. You can see the reasoning behind each recommendation and adjust it to fit how you grow.
What this means in practice
The old charts treated gardening as a calendar task. This new approach treats it as a living pattern that changes with your setup and the weather around you. Seeing those differences on screen has changed how I think about timing. It makes planning feel practical instead of uncertain, and it reminds me that good gardening is not about following rules but about understanding the conditions you actually have.
Find your local frost dates with the Frost Date Finder. For a quick way to calculate sowing, transplant, and harvest dates for specific crops, try the Crop Timeline Calculator.